ReportTemplateAttachment Editor/en
The results of a test execution can be visualized by creating a test report. These reports can be created as PDF or HTML documents. Its also possible to create an XML, plain text or a CSV file containing all relevant information on the test execution. Do not confuse reports with the expecco log file (".elf"-file), which can also be saved after a testrun, and which contains all data needed to either rerun the test and/or to see all of the logged data.
Inhaltsverzeichnis
Report Templates[Bearbeiten]
Report templates are used to specify the content and layout of created reports. By default the so called "Default Report Template" is used to create reports, which is stored in the user's private settings file.
Other (multile) report templates can be added to a test suite by creating a report template element to the tree. These will be saved together with the test suite.
How to create a report[Bearbeiten]
To create a report, a test has to be executed first. This can be either a single block test or a whole test plan. This can also be for a test execution which was performed within the current expecco session, or from a previously saved testrun's ".elf" file.
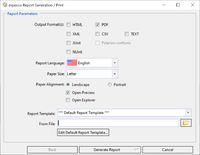
After the execution is finished, click on the "Print Report" button (![]() ) causing a dialog to open.
) causing a dialog to open.
Here you can select the output format (PDF, HTML, XML, CSV or TEXT), the report language, paper format (either DIN A4 or Letter format) and a template for the report. This template can be the default report template, a template from the current test suite or a template which is stored separately in a file. You can also choose to edit the default report template.
How to customize a report template[Bearbeiten]
To customize a report template, select it in the navigation tree and change as required in the related editor. The same editor is also used to modify the "Default Report Template". You can access it either via the already mentioned dialog or via the general expecco settings.
Filter Settings[Bearbeiten]
These settings determine which items are part of the report. This way you can create either detailed or condensed reports.
Testsuite[Bearbeiten]
- Do not the Print Test Suite Environment
This option determines whether the test suite environment, i.e. the variables defined in the current testsuite, are part of the test report. Please note that only variables which are defined as read-only will be shown in the report because the value of other variables can change during the test execution.
Testplan[Bearbeiten]
- Do not Print Test Plan Environment
This option determines whether the environment of each executed test plan, i.e. the variables defined in the respective test plan, are included in the report. Please note that only variables which are defined as read-only will be shown in the report.
- Do not Print Successful Test-cases
This option removes all successful test cases from the report when checked. Thus only failed, erronous and inconclusive tests are reported.
- Only Print Test-plan Summary
If checked this option will reduce every test plan to a summary of the results of the different test plan items, i.e. it removes all further information as sub activities or logs.
- Print Unexecuted Test Cases
This option also includes test cases to the report which have not been executed.
- Print Pre/Post Condition
This option determines whether the pre and post executions are present in the report or not. You can also add this information only in case their execution failed.
Activity[Bearbeiten]
- Nesting Limit
This option is used to determine down to which level nested sub activities are reported. This affects the length and also the level of detail of the generated report.
- Activity Tags
In order to include or exclude activities spawned by certain blocks from the report you can add tags to each block. These tags can be set in the documentation tab of the block. Later you can filter the executed blocks by their tags. Please note that an inclusion to the report has priority over an exclusion.- Include Tag(s)
All blocks which have one or more of those tags will be present in the report. Multiple tags must be separated by ";". - Exclude Tag(s)
All blocks which do not have one or more of those tags will be present in the report. Multiple tags must be separated by ";". - Sub-activities Include Tag(s)
All sub activities which have one or more of those tags will be present in the report. Multiple tags must be separated by ";". - Sub-activities Exclude Tag(s)
All sub activities which do not have one or more of those tags will be present in the report. Multiple tags must be separated by ";". - Search Tags in Children
This option determines whether the sub activities of an activity are even searched for existing tags.
- Include Tag(s)
- Print Input/Output Pins
This option determines whether the data of input and output pins is present in the report. You can also add this information only in case the execution failed.
- Do not Print Output Pins
This option removes the data of the output pins from the report.
Logs[Bearbeiten]
These settings are used to specify how logs are reported.
- Nesting Limit
This option is used to determine down to which level logs of nested sub activities are reported.
- Log Tags
In order to include or exclude logs of certain blocks from the report you can add tags to each block. Please note that an inclusion to the report has priority over an exclusion.- Include Tag(s)
All logs of blocks which have one or more of those tags will be present in the report. Multiple tags must be separated by ";". - Exclude Tag(s)
All logs of blocks which do not have one or more of those tags will be present in the report. Multiple tags must be separated by ";". - Search Tags in Children
This option determines whether the sub activities of an activity are even searched for existing tags.
- Include Tag(s)
- Log Types
These check boxes are used to include or exclude different log message types from the report. Please note that there is a difference between logs that only change the state of an activity, e.g. "logFail", and real exceptions that stop the execution, e.g. "fail". The "All" button is used to toggle all types.
Presentation Settings[Bearbeiten]
These settings are used to determine how the report is presented.
Common[Bearbeiten]
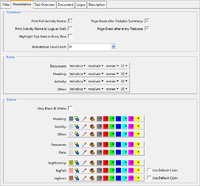
- Print Full Activity Name
This option determines whether the name of the corresponding block is printed when a step is reported, as opposed to the underlying activity's name. This is only relevant for steps which have been renamed individually.
- Print Activity Name in Logs as Well
This option determines whether the name of the activity which logged a message will be printed in front of the message.
- Indention Level Limit
This option is used to determine down to which level reported sub activities are indented.
- Highlight Top State in Every Row
This option adds a colored area with the top state color in every row. This helps to keep track of the overall test case result in case that many sub activities are reported.
- Page Break after Test-plan Summary
This option will add a page break after a test plan summary.
- Page Break after every Test-case
This option will add a page break after every test case.
Fonts[Bearbeiten]
These settings are used to change the fonts used for the document, the column headers and the activity reports.
Colors[Bearbeiten]
These settings are used to change the color of different report items. Its possible to use the default color as defined in the settings for error and failure logs. You can also print a "Only Black & White" report by toggling the corresponding check box, in case you intent to print on a B&W printer.
Test Overview Settings[Bearbeiten]
These settings can be used to customize the report summary.
- Test Plan Summary
Here you can specify how the summary of a test plan is presented. The editor panel is described here: Editor Panel - Activity Summary
Here you can specify how the summary of an activity is presented. The editor panel is described here: Editor Panel
Document Settings[Bearbeiten]
These settings apply on the general design of the report. Note that the header and footer line will only be present in a PDF report.
- Document Header
Here you can create a header for the report. The editor panel is described here: Editor Panel - Columns Width
Here you can resize the three columns of the report. Please note that each column has to fill at least 10 percent of the entire width. - Header
These text fields are used to edit the header line of the report. The left fields are used to enter left aligned text, the center ones for center aligned text and the right ones for right aligned text. You can also create links by typing a target into the "link" fields under the text fields. - Footer
These text fields are used to edit the footer line of the report. The usage is similar to the header line fields.
Logo Settings[Bearbeiten]
These settings are used to specify images, e.g. company logos, which can be used in the report. By default the expecco logo is used. To replace the default images just click on the "replace" button behind the filenames and select the new image's file in the file dialog. Please note that the file type has to be ".jpg".
Description[Bearbeiten]
Here you can add a description for the report template. This can be useful to inform other users for example when to use this template.
Editor Panel[Bearbeiten]
This editor panel is used to create style information for report summaries and the report header.
The workspace is made up of a number of rows which are separated columns (limited to a maximum of 6 columns). A single field is called cell. It can contain either text or graphics, such as a pie chart or a logo.
To enter text, double click on the cell causing a text editor to open.
To insert graphics, right click on a cell, select "Insert Graphic" and define the type of the graphic. Please note that pie charts are only available for test plan reports and logos only for the document header.
Inside text, placeholder variables, such as the name of the test suite or the current date can be inserted: double click on a cell to open the editor and right click to open the context menu. Now select "Insert Variable" and choose one of the variables from the list. Currently, variables available in a test plan overview are:
- %testplan_name% - The name of the test plan
- %testcases_size% - The number of test cases in the test plan
- %testcases_executed% - The number of test cases in the report
- %hostname% - The host name of the executing machine
- %username% - The user name (login name)
- %start_date% - The date when the test plan was started
- %start_time% - The time when the test plan was started
- %run_time% - the overall execution time of the test plan (when finished)
- %elapsed_time% - the elapsed execution time of the test plan (only useful if a GenerateReport block is used from within an executing test plan. same as run_time when finished)
Variables available in an activity-overview are:
- %action_name% - The name of the activity
- %hostname% - The host name of the executing machine
- %username% - The user name (login name)
- %start_date% - The date when the activity was started
- %start_time% - The time when the activity was started
- %end_date% - The date when the activity has finished
- %end_time% - The time when the activity has finished
- %run_time% - the execution time of the activity
Common variables are:
- %business_unit% - from the settings
- %company_name% - from the settings
- %principal_office% - from the settings
- %responsible% - from the settings
- %reportTemplate_name% - name of the template
- %testsuite_name% - name of the suite
- %comment_header% - from the settings
- %comment_text% - from the settings
- %date% - current date
- %hostname% - name of the executing machine
- %loginname% - login name of the user
- %username% - name of the user
- %extra_SUTVersion% - value provided by the SUT version extract action
- %extra_OS_TYPE% - operating system (eg. windows, linux, osx)
- %extra_OS_RELEASE% - operating system release
- %extra_OS_VERSION% - operating system version
- %extra_CPU_TYPE% - eg. x86, x65_64
- %extra_CPU_POINTERSIZE% - 4 or 8
- %extra_CPU_MEMORYSIZE% -
- %extra_EXPECCO_VERSION% - eg. 24.1
Buttons[Bearbeiten]
 Inserts a new row after the selected one
 Inserts a new column right from the selected one. Please note that only the selected row is affected.
 Removes the selected row
 Removes the selected column
 Moves the selected row up/down
 Moves the selected column left/right
 Opens an editor to modify the content of the selected column
 Closes the editor with saving changes
 Closes the editor without saving changes

 Aligns the content of the column left/center/right
 Shows/Hides a grid to resize the columns
Example: Executive Summary vs. Developer Report[Bearbeiten]
The main advantage of report templates is the possibility to create standardized reports for different purposes. This way you can for example create a condensed report as a summary for an executive or a very detailed one for the development team to track down error causes or to document a test run.
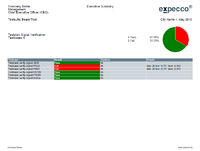
In the shown example the executive summary solely shows the overall test results which are visualized by a pie chart. Other irrelevant information has been removed to keep the report clear and readable. A corresponding template can be found here: Datei:Executive Summary Template.ert
The shown developer report is more detailed and shows all relevant data to track down a possible error. In this case all irrelevant data from the developer's point of view is left out. For example the pie chart might not be useful in this case.
A corresponding template can be found here: Datei:Developer Report Template.ert


