Octave Script Action Tutorial
Inhaltsverzeichnis
Introduction[Bearbeiten]
GNU Octave is a language interpreter with a Matlab compatible interface (not the full Matlab functionality is available, and some functions may behave differently. But for a knowledgable Matlab user, this may still be a highly usable option).
Example Session1: Display a Graph of a Function[Bearbeiten]
As a first simple example, we'll create an action which displays a simple sin-graph in a separate view. Obviously, you will eventually want to display your own data (measurement data vectors), but we start simple here.
Click on "New Octave Action" in the project's tree menu:
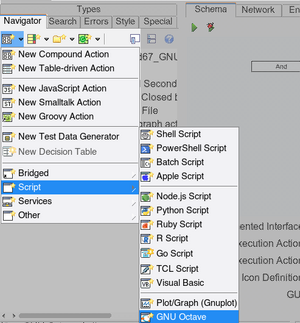
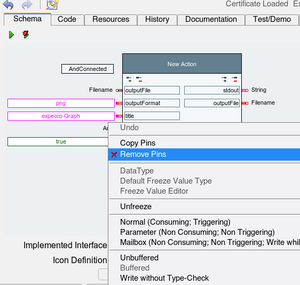
The new created action will have a number of automatically created input and output pins, which we will not need in this example (these pins and their functions will be described later). So those should first be deleted:
- go to the new action's "Schema Tab",
- select the pins (either via a lasso, or by shift-clicking on the pins),
- then right-click for the context menu,
- select "Remove Pins"
We now have an acton with no input- and no output pins.
Next, modify the code (Matlab syntax). The default was generated as an example and for quick go/nogo smoke test.

We won't go into details of the code here; it sets up x and y and plots them, followed by setting the graph's title and axis labels.
Finally, there is an additional "uiwait" call, which forces the graph-window to remain open until the user closes it manually. Without this, the window would immediately disappear when the action finishes (i.e. when the script reaches the end).
Alternatively to "uiwait", you can also use "pause(N)", to leave the graph window open for N seconds.
Finally, run it, by pressing the green "execute"-button.
If all goes well (i.e. you have correctly installed and configured octave), the graph window should appear:
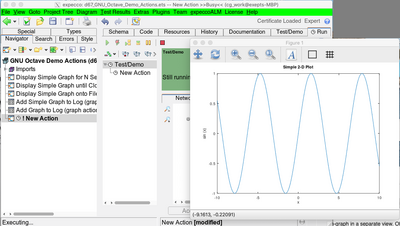
The action remains in the "executing" state, until the graph window is closed.
Running with a 'Real' Matlab[Bearbeiten]
Go to the Octave settings and specify as path the matlab path. For example (in Windows):
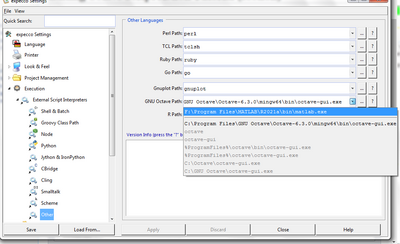
Below is a screen shot of the same action with matlab configarution:
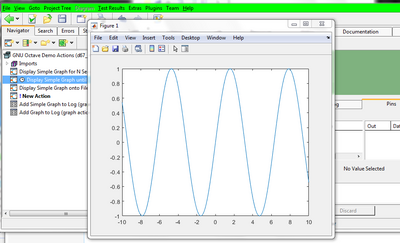
Be aware that the startup time of matlab is much longer than eg. octave (matlab: 2min when started for the first time, 30s when started again; 3 seconds with octave on the same machine). Be patient.
Default Pins of Octave Actions[Bearbeiten]
By default, a number of pins are created which may or may not be useful, depending on your application. We assume that most users will use octave/matlab to add graphics to logs and reports. The default pin setup is targeted towards those users. The action will then expect that the script generates a graphic to the file named "$(outputFile)", and will fail if that is not the case.
If your script is not meant to generate an image, please remove the pins named "outputFile", "outputFormat", "title" and "attachToLog". If the script does not expect any input data (vector or matrix), then also remove the pin named "data".
Caveat[Bearbeiten]
Under Octave, the possibly undesired Octave control GUI will popup. Although this could in theory be disabled (with the "--no-gui" command line option), disabling will break the image saving capabilities (because then, octave will complain abut a missing qt display framework).
For now, until we find a workaround for this, we have to live with this little inconvenience.
See Also[Bearbeiten]
Examples in:demo\d67_GNU_Octave_Demo_Actions.ets (under the deployed examples folder)
External Tools Settings (path configuration)
Installing additional frameworks
