Java Debugger/en
The Java Debugger plugin provides basic Java debugging facility. It allows for debugging of Groovy blocks and any other Java code run in remote JVM directly within expecco.
Inhaltsverzeichnis
Breakpoints[Bearbeiten]
Debugger[Bearbeiten]
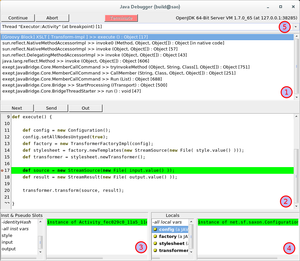
The overall layout of Java debugger window is similar to debuggers for Smalltalk and JavaScript blocks. It consists of 5 panes:
1 Execution Stack - organized top-to-bottom, i.e., the currently executing method is the first entry in the list.
2 Source Code View - shows the source code of the currently selected method (in execution stack pane). Source for particular method may or may not be available. For details refer to section Managing Sources
3 this object inspector - an embedded inspector of this objects, i.e., on the receiver of the method.
4 Method parameters and locals inspector - an embedded inspector showing all method parameters and local variables which are visible at current scope.
5 Thread List - list showing all threads in the remote JVM. The Execution Stack pane shows execution stack of selected thread.
Following debugging operations are available:
- Continue - resumes execution until remote JVM terminates or another breakpoint is reached.
- Abort - aborts execution of currently executing expecco Groovy block. If the selected thread does not execute a Groovy block abortion
is not allowed.
- Next - aka Step-over. Single-step to next line in currently selected method. Does not enter into called methods.
- Next - aka Step-into. Single-step to next line in currently selected method or into a called method.
- Out - aka Step-out. Run until currently selected method returns and stop's at the method's caller.
