Release18 1 UI Enhancements
Inhaltsverzeichnis
UI Changes, Enhancements and New Features in Release 18.1[Bearbeiten]
Main Menu[Bearbeiten]
Goto Menu[Bearbeiten]
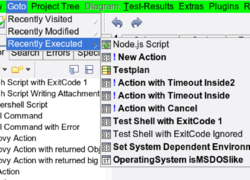
An additional menu to quickly navigate to recently visited/used and executed items:
Extras Menu[Bearbeiten]
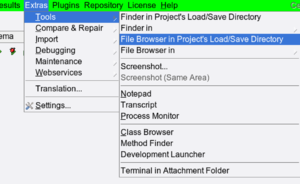
The "Extras" menu was reorganised into groups and is now more compact. Additional menu items are found in the "Compare & Repair" group and the "Debugging" group.
One particular useful function is "Open FileBrowser/Finder in Project's Load/Save Folder":
Settings Dialog[Bearbeiten]
Date/Time Format[Bearbeiten]
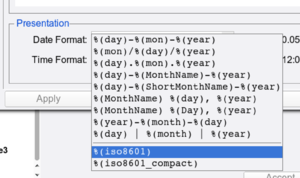
2 new date/time representations (ISO8601 and ISO8601-compact) offered in the "Settings" - "Language" dialog:
New Script Actions[Bearbeiten]
In previous versions, all pins of a script action were initially created, which made the diagram look ugly, with man unused pins. Now, unused pins can be removed and also added later, if required (via the step's "Special Pins" menu). You can choose the old behaviour (all pins) or the new behaviour (only minimum set of pins) in the "Settings" - "Look & Feel" - "Diagram Editor" dialog:
Colors of Handled Exceptions (in the log/report)[Bearbeiten]
These used to be drawn as unsuccessful/handled, with a yellowish color. Some customers did not like this, as it made the report look like unsuccessful. It is now possible to choose these colours separately in "Settings" - "Look & Feel" - "State Colors":
Execution Directory of Scripts[Bearbeiten]
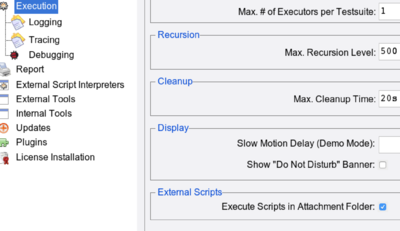
Previously, scripts (shell, python, etc.) were executed in the executor's temporary folder; this made it inconvenient for the scripts to refer to attachment files. Now, by default, they are executed inside the attachments folder, and can thus refer to attachments directly without a file-path prefix. In case this breaks any existing old suite, the old behaviour can be set via "Settings'"' - "Execution":
Logging/Trace/Debugging Settings[Bearbeiten]
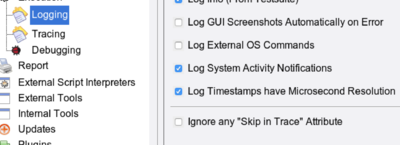
Were slightly reorganised into 3 different setting pages.
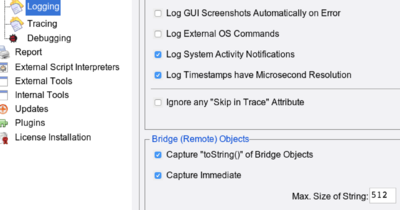
Additional log settings are: "Log External OS Commands" and "Log Timestamps have Microsecond Resolution". The later may depend on the underlying operating system (not all systems provide timestamps in that resolution).
An additional section to control if and how remote- (i.e. bridge) objects are to be kept in the activity log:
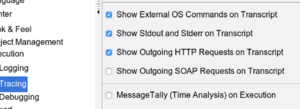
A new flag "Show External OS Commands on Transcript" was added to the "Tracing" settings, and the message tally is now found there:
External Script Interpreter Setup[Bearbeiten]
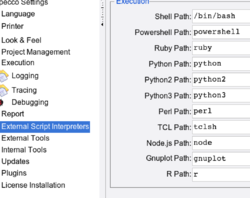
These settings are now found in a separate page (they used to be in "External Tools") because there are now quite a number of them:
Access to Online Documentation via HTTPS[Bearbeiten]
You can now choose between HTTP and HTTPS in the "External Tools" setup:
[Bearbeiten]
New Keyboard Shortcuts[Bearbeiten]
CTRL-SHIFT-CursorUp and CTRL-SHIFT-CursorDown to move the selected item(s) to the top/bottom of their container (i.e.. within the list of children).
Additional Script Actions[Bearbeiten]
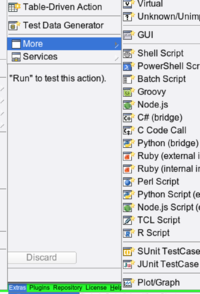
A number of additional script actions is provided in the "New Action" - "More" menu:
Quick Setting for Common Tags[Bearbeiten]
For a number of common tags, direct menu items ("Mark as Private", "Mark as Test Case" and "Mark as Test Step") have been added to the "More" menu:
Project Compare[Bearbeiten]
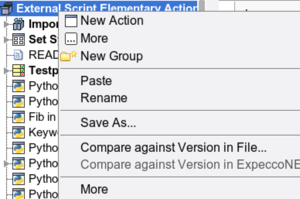
The selection menu for projects and imported libraries includes a "Compare against Version in File" item:
which opens the diff-browser tool.
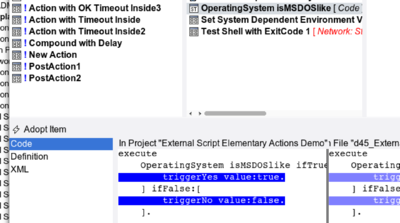
The diff-browser now has an "Adopt Item" (and when an individual attributes is selected, an "Adopt Attribute") button to copy the item or attribute from the file into your suite:
Diagram Editor[Bearbeiten]
Patches Service for Other Expeccos[Bearbeiten]
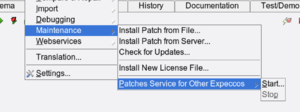
In isolated labs, it used to be a tedious task to copy patches and updates to the individual machines. One expecco can now provide the patches to other expects within one network and thus new patches need only be installed on one single machine. In a server farm, all other expects can - even when isolated from the outside world -- fetch those patches from that one machine.
