Octave Script Action Tutorial: Unterschied zwischen den Versionen
Cg (Diskussion | Beiträge) |
Cg (Diskussion | Beiträge) |
||
| Zeile 20: | Zeile 20: | ||
Next, modify the code (Matlab syntax). The default was generated as an example and for quick go/nogo smoke test. |
Next, modify the code (Matlab syntax). The default was generated as an example and for quick go/nogo smoke test. |
||
<br>[[Datei: |
<br>[[Datei:Octave code edit1.png|300px]] |
||
Version vom 2. September 2021, 10:22 Uhr
Introduction[Bearbeiten]
GNU Octave is a language interpreter with a Matlab compatible interface (almost - not the full Matlab functionality is available, but a reasonable subset).
Example Session1: Display a Graph of a Function[Bearbeiten]
As a first simple example, we'll create an action which displays a simple sin-graph in a separate view. Obviously, you will eventually want to display your own data (measurement data vectors), but we start simple here.
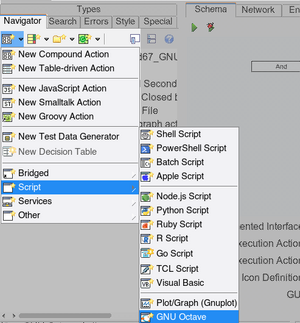
Click on "New Octave Action" in the project's tree menu:

The new created action will have a number of automatically created input and output pins,
which we will not need in this example (these pins and their functions will be described later). So those should first be deleted:
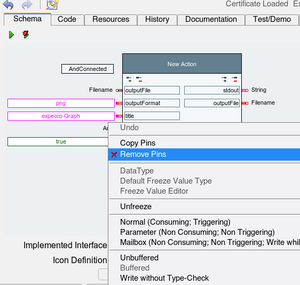
- go to the new action's "Schema Tab",
- select the pins (either via a lasso, or by shift-clicking on the pins),
- then right-click for the context menu,
- select "Remove Pins"
We now have an acton with no inputs and no output.
Next, modify the code (Matlab syntax). The default was generated as an example and for quick go/nogo smoke test.

