Java Debugger/en: Unterschied zwischen den Versionen
Jv (Diskussion | Beiträge) |
Jv (Diskussion | Beiträge) |
||
| Zeile 37: | Zeile 37: | ||
== Object Inspector == |
== Object Inspector == |
||
[[Datei:expecco_JDebugger_002.png|right|thumb|JDebugger plugin: Java object inspector]] |
|||
Version vom 8. Oktober 2014, 15:03 Uhr
Inhaltsverzeichnis
Introduction[Bearbeiten]
The Java Debugger plugin provides basic Java debugging facility. It allows for debugging of Groovy blocks and any other Java code run in remote JVM directly within expecco.
The plugin provides a way to place breakpoints into a Java or Groovy code. When breakpoint hits (particular location in the code is reached), the program is stopped and a visual debugger appear. The debugger then can be used to inspect the state of the execution and/or single-step through the code.
Debugger[Bearbeiten]
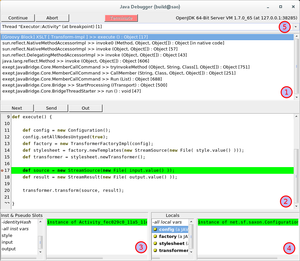
The overall layout of Java debugger window is similar to debuggers for Smalltalk and JavaScript blocks. It consists of 5 panes:
1 Execution Stack - organized top-to-bottom, i.e., the currently executing method is the first entry in the list.
2 Source Code View - shows the source code of the currently selected method (in execution stack pane). Source for particular method may or may not be available. For details refer to section Managing Sources
3 this object inspector - an embedded inspector of this objects, i.e., on the receiver of the method.
4 Method parameters and locals inspector - an embedded inspector showing all method parameters and local variables which are visible at current scope.
5 Thread List - list showing all threads in the remote JVM. The Execution Stack pane shows execution stack of selected thread.
Following debugging operations are available:
- Continue - resumes execution until remote JVM terminates or another breakpoint is reached.
- Abort - aborts execution of currently executing expecco Groovy block. If the selected thread does not execute a Groovy block abortion
is not allowed.
- Next - aka Step-over. Single-step to next line in currently selected method. Does not enter into called methods.
- Next - aka Step-into. Single-step to next line in currently selected method or into a called method.
- Out - aka Step-out. Run until currently selected method returns and stop's at the method's caller.
Breakpoints[Bearbeiten]
Java Debugger plugin supports two kinds of breakpoints:
- Line Breakpoints - a traditional breakpoint set on particular line in particular method.
- Exception Breakpoints - a breakpoint that suspends execution when an exception of specified type is thrown. This is useful to find out where a particular exception is thrown.
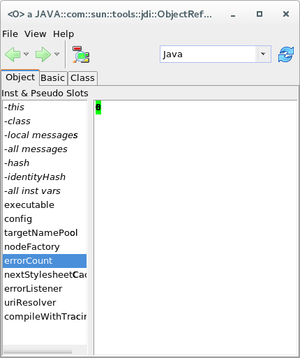
Object Inspector[Bearbeiten]
Managing Sources[Bearbeiten]
Java Debugger plugin uses Java Browser/en fro accessing source code. The source code for particular class / method is looked up in Java Browser's default workspace. This means that if the default workspace does not contain a source code for the class, Java debugger will not show source code. However, it is still possible to inspect parameters and other local variables and even single-step.
If the sources does not match the sources which the Java code has been compiled from, Java debugger may show invalid source code or line numbers may not match. There is no way to validate the sources matches the code loaded in remote JVM.
For more information about default workspace and how to add classes and sources to it, please refer Java Browser plugin documentation

