Timeline/en: Unterschied zwischen den Versionen
Matilk (Diskussion | Beiträge) K (→Mouse Input) |
Matilk (Diskussion | Beiträge) |
||
| Zeile 27: | Zeile 27: | ||
== Mouse Input == |
== Mouse Input == |
||
Normal scrolling moves the diagram vertically, scrolling with the Shift key held down moves it horizontally. You can zoom in and out on the cursor position by scrolling while holding down the Ctrl key. If stretch is disabled, you can click at a point in the timescale and drag to another to select a time period, which is highlighted in yellow. When you release the mouse button, the timeline zooms to that period. |
|||
[[Datei:Timeline_Select_Time.png]] |
[[Datei:Timeline_Select_Time.png]] |
||
Version vom 15. November 2023, 16:22 Uhr
Inhaltsverzeichnis
Introduction[Bearbeiten]
The Timeline can be a useful tool, when you want to understand the chronology of your test sequence, especially when actions are running in parallel. It can be found in the Run section of either a testplan or an action block. It uses the information collected in the Activity Log to show when and for how long an action was executed.
Representation[Bearbeiten]
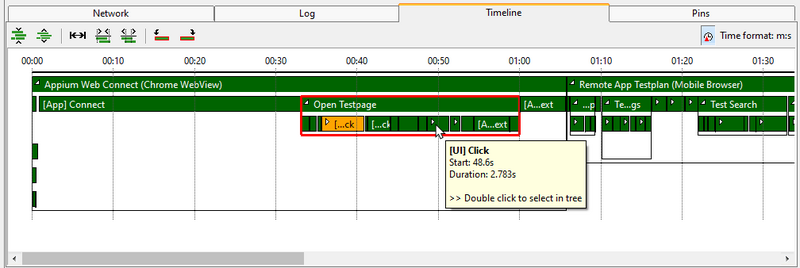
The timeline shows the subblocks of the selected block as bars in the color of their execution state, where their length and horizontal position represents the duration and start time of their execution. The timescale at the top adapts to the presented time. You see the current time format in the top right corner, e.g. m:s means minutes and seconds separated by a colon, where the seconds may have digits after the decimal point to show the milliseconds.
Initially only the top blocks of the selected blocks are shown. If blocks are executed in parallel, they go in different lines, consecutive blocks are in one line. However, if two blocks are one after the other in the same line, that does NOT indicate, that the first block triggered the second.
You can expand blocks, to see its subblocks. If a block is wide enough, it shows a little expand icon in its left corner. You can expand or collapse the block by clicking on this icon. Alternatively, you can right click on a block and select expand or collapse from its context menu. The subblocks are displayed below their parent block, pushing any parallel block further down in the diagram. The frame of a block includes its subblocks, visualizing the nesting. If you hold Ctrl when expanding a block, it will expand all of its children. As the timeline only displays the information from the Activity Log, you can only see the blocks, that have an log entry. You cannot see blocks, that are skipped in the log.
If you click on a block in the timeline it gets selected, which is indicated by a red frame. The main information of that block is added to the messages in the lower left corner of the expecco window. You also get this information as tooltip when hovering over a block.
[Bearbeiten]
As default the whole duration is displayed in the panel, but you can zoom in, to better see a certain section. You can use the buttons of the menu bar to navigate through the timeline and use the mouse.
Menu bar[Bearbeiten]
- Decrease the height of lines
- Increase the height of lines
- Stretch the timeline to the available width
This is a toggle, if it is on, the whole run time is stretched to the width of the panel. - Zoom out
Decrease the width of the timeline, so that more time is shown in less space. - Zoom in
Increase the width of the timeline, so that less time is shown in more space and can be analyzed better. - Jump to the start of the selected action
- Jump to the end of the selected action
- Relative execution times
The block information e.g. in the tooltip shows the start time relative to the start time of the displayed block and the duration if on, or the absolute start and end time if off.
Mouse Input[Bearbeiten]
Normal scrolling moves the diagram vertically, scrolling with the Shift key held down moves it horizontally. You can zoom in and out on the cursor position by scrolling while holding down the Ctrl key. If stretch is disabled, you can click at a point in the timescale and drag to another to select a time period, which is highlighted in yellow. When you release the mouse button, the timeline zooms to that period.
Selecting[Bearbeiten]
As earlier already mentioned, you can select a block by clicking on it. When double clicking on it, it gets selected in the tree and so the timeline will switch to only display the subblocks of this block.
You can also lock the timeline (and as well the network, log and pin entries) to the block selected in the tree, by activating the toggle ![]() in the menu of the tree. This will be indicated by a little lock icon next to the tree icon of the locked block. If you now select another block in the tree, it gets selected in the timeline of the locked block. Similar you can double click on a block in the timeline and its entry in the tree will be selected without changing the displayed timeline.
in the menu of the tree. This will be indicated by a little lock icon next to the tree icon of the locked block. If you now select another block in the tree, it gets selected in the timeline of the locked block. Similar you can double click on a block in the timeline and its entry in the tree will be selected without changing the displayed timeline.


