Using Gnuplot Action Blocks: Unterschied zwischen den Versionen
Cg (Diskussion | Beiträge) |
Cg (Diskussion | Beiträge) |
||
| Zeile 78: | Zeile 78: | ||
we create another action bock, which runs the above action multiple times and collects |
we create another action bock, which runs the above action multiple times and collects |
||
all the execution times: |
all the execution times: |
||
[[Datei:Multiple_Measuring_MQTT.png]] |
|||
Version vom 26. März 2018, 17:33 Uhr
Inhaltsverzeichnis
Using Gnuplot Action Blocks[Bearbeiten]
With expecco18.1, a new block type is introduced: "Gnuplot Graph Actions". These behave similar to other script action blocks, in that they are defined by a script (in this case: gnuplot scripting language) and are placed into the test sequence flow just like any other block.
However, when executed, these actions generate a graphic document (jpeg, png or postscript), which is then either added to the activity log, or added as attachment. It will therefore be available in the generated "elf" execution log file, or shown in the generated "pdf" report file.
Example: Gathering Response Times of Protocol Messages[Bearbeiten]
This example demonstrates, how a test suite can gather response times of a remote system, when sending MQTT messages to it.
Step 1: Define the Test Sequence[Bearbeiten]
this is a very simple publish-response setup, in that a topic is published to an MQTT broker, and the time measured, until the notification arrives (in order to run this on your machine, the expecco MQTT plugin needs to be installed):
Outside (Schema) view of the measuring action:
which is implemented as:
The yellow area does the MQTT setup. First, an MQTT client connection is created, and the client handle forwarded to the Subscribe action, which registers expecco to react to the "expeccoTesting/test" topic.
The green area does the actual publish operation, publishing the "Hello from Expecco" string on this topic.
In parallel, the blue area waits for the next incoming event, (and generates a printed detail info on the received packet for the activity log).
The red area contains a stopWatch action block, which gets started with when the publish is done, and stops when the event arrives.
The measurement action is prametrized with the broker's host and port, and generates the measured timeDuration as output.
Step 2: Test Run[Bearbeiten]
Assuming that you have an MQTT client running on the local host, the test sequence can be immediately tried via the Test/Demo page:
A good strategy is to package the MQTT broker into a docker file. Here is the MQTT client's output of the above run:
$ sh rundocker.sh
1522084243: mosquitto version 1.4.8 (build date Thu, 01 Mar 2018 09:34:49 -0500) starting
1522084243: Using default config.
1522084243: Opening ipv4 listen socket on port 1883.
1522084243: Opening ipv6 listen socket on port 1883.
1522084272: New connection from 172.17.0.1 on port 1883.
1522084272: New client connected from 172.17.0.1 as expeccoMQTT (c1, k0).
1522084272: Client expeccoMQTT disconnected.
and here the activitylog in expecco:
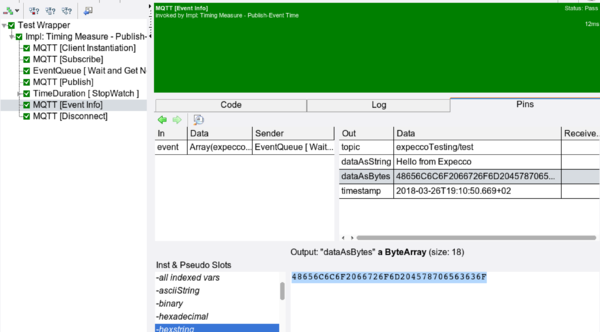
with the event info detail:
Step 3: Running that Sequence Multiple Times[Bearbeiten]
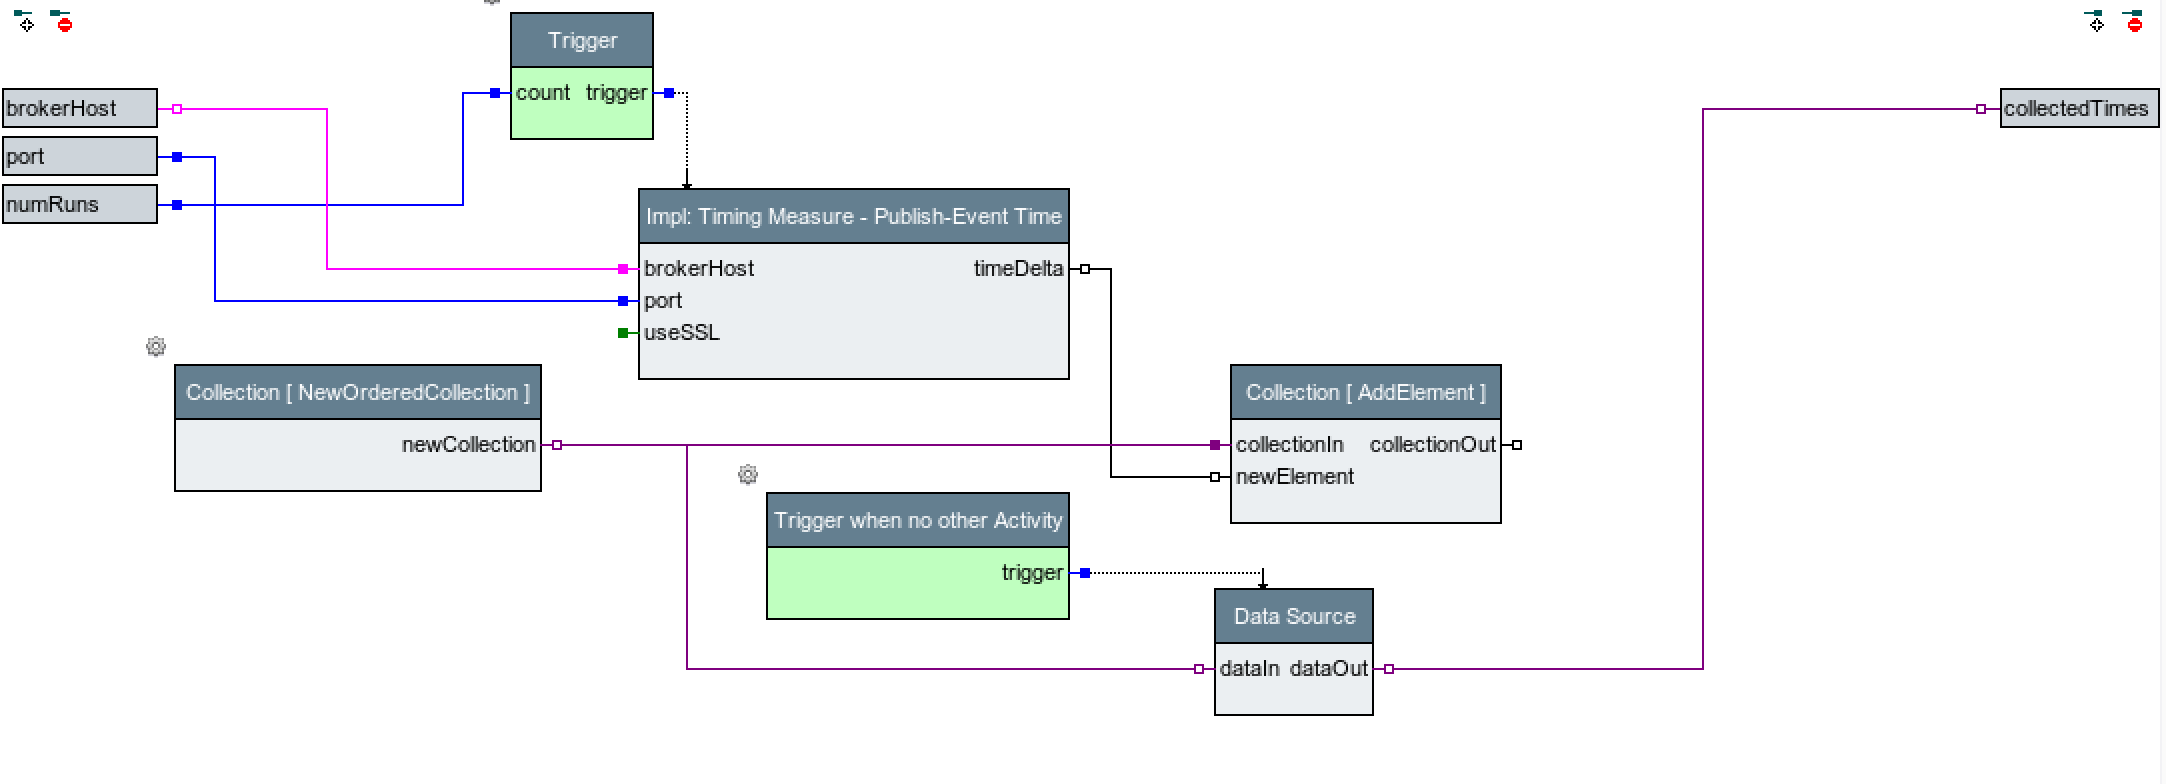
Now that we have verified, that the communication with the MQTT broker works correctly, we create another action bock, which runs the above action multiple times and collects all the execution times:


